

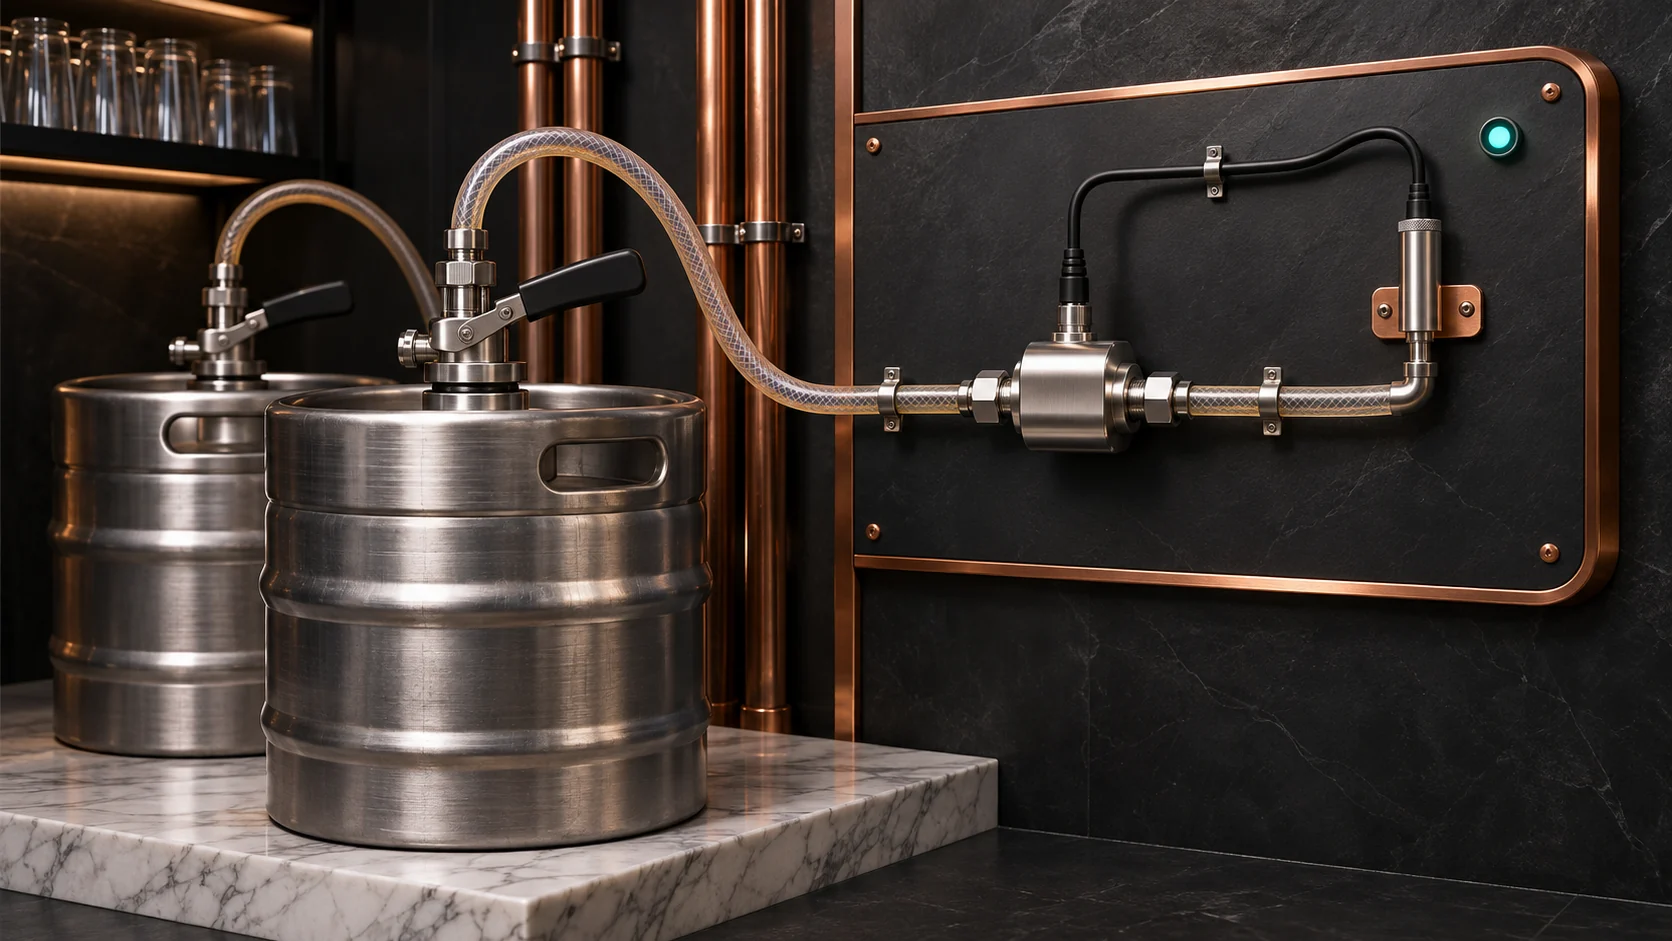
When a keg runs out earlier than expected, start by reconciling the liquid measured at the tap with POS serving sizes and documented non-sale pours. The difference tells you where to investigate. Keep line cleaning on a separate record. A flow trace can show that something moved through the line, but the service record and required checks establish whether cleaning was completed.
This guide is for bar managers, venue beverage operators, and the draught technicians who maintain their systems. Start with two taps and one service window before equipping a keg room.
Map the keg, tap, and POS items first
Assign a stable ID to each tap and line. Record which keg and beer were connected during each shift, when they changed, and which POS menu items and glass sizes correspond to that product. POS sales may identify a beer without identifying a tap. If two lines serve the same product and the staff cannot distinguish them at the register, report the combined volume or leave the allocation unresolved.
Convert POS items to their approved serving volumes instead of comparing cash totals with ounces. A 16-ounce pint, a 12-ounce pour, and a 4-ounce sample need separate mappings. Count recorded comps and tastings once. Decide how voids, returns, foam, and line purges are represented. For a void after a drink was poured, keep the physical pour in the documented exception volume even if the sale no longer appears as paid.
Choose the same service interval for both systems. Record the time zone, the event time and the export time. A round poured near close can appear in the POS later. Reconcile by tap and shift, and use individual examples only when staff can verify the timing and assignment.
Measure liquid flow and temperature within the sensor’s limits
Use an inline pulse meter only if the draught equipment manufacturer and qualified installer approve the exact part and connection for that line. Confirm the wetted materials, seals, cleanability, pressure and temperature ratings, and compatibility with the intended beverage and authorized cleaning procedure. Review applicable local equipment requirements. NSF’s food equipment standards overview distinguishes equipment and component standards, and FDA food-contact guidance explains why intended use matters. Verify the exact listing or supporting documentation where applicable. A generic “food-grade” label is too broad to resolve the application.
A turbine meter with a Hall-effect pickup can emit pulses as liquid moves through it. Check its specified output type and electrical levels. Have the installer provide a suitable input interface for the pulse logger, including conditioning or isolation as the design requires. Verify one documented edge per pulse, valid pulse widths, and noise from adjacent equipment. Too much filtering can suppress genuine pulses. Too little can count electrical noise as volume. Compare metered totals against a suitable independent volume reference across expected serving sizes and flow rates. Bubbles, foam, out-of-range flow and a changing pressure drop can degrade the result. Record the uncertainty the pilot actually demonstrates.
The original ESP32 used in modules such as ESP32-WROOM-32E has eight hardware PCNT units in one group. A design can allocate one independent unit per tap if no other function already uses them. The two channels within a unit act on the same counter. Units within a group share clock and interrupt constraints. Use the Espressif PCNT guide to account for counter limits and noise filtering. Preserve cumulative totals and session timestamps across a network outage, and flag any power-loss period where pulses could not have been counted.
A contact temperature probe on the glycol supply or return can help compare cooling conditions over time. Record exactly where it is mounted and whether the measurement is of the pipe surface or the fluid. It cannot establish serving temperature at the faucet. If the operator needs that value, use the qualified provider’s approved measurement method and compare readings under representative conditions. Keep refrigerant, glycol, dispense pressure and valves outside the monitoring design.
Reconcile a worked shift before assigning a cause
Suppose the validated example calibration factor is ten pulses per U.S. fluid ounce. One tap records 15,000 service pulses, equivalent to an estimated 1,500 fluid ounces. The POS shows 84 completed 16-ounce servings, or 1,344 ounces. The shift log documents another 80 fluid ounces, measured or estimated as liquid in authorized tastes and discarded foam. This is the volume of beer in the foam after settling, separate from the POS total. That leaves 76 ounces unclassified, about 5.1% of the metered volume in this illustrative shift.
Review whether the portion mapping, taps, and timestamps agree, then check event gaps and the meter’s uncertainty. For example, a field-verified uncertainty band of ±3% at this volume would be ±45 ounces for the meter alone. POS portion assumptions and manually logged waste have their own uncertainty. Look for a pattern across comparable shifts before drawing a conclusion. An unclassified difference is not evidence of theft, and it cannot establish financial loss without reliable measurements and business context.
If a nearby tap also serves the same beer, confirm whether it was used before investigating one tap’s apparent variance. If an out-of-range or unpowered interval overlaps the shift, mark the result incomplete rather than treating missing pulses as zero.
Verify cleaning with its own evidence
Give each cleaning session a separate record tied to the affected line IDs. Capture the responsible technician, the scheduled window, start and end, the approved procedure and its required check results, and the person who authorized return to service. Attach the flow trace as supporting evidence when the meter is designed for the process. Keep any beer discarded around the changeover distinguishable from cleaning-fluid flow and normal service. A missing or unscheduled trace should prompt a follow-up with the technician.
Similar flow patterns can occur during a rinse, recirculation, a purge or an ordinary pour. The trace cannot identify a cleaning chemical, confirm concentration, prove contact time at all relevant points, or establish that the required rinse and inspection were completed. The Brewers Association Draught Beer Quality Manual explains the elements of cleaning effectiveness. Its line-cleaning log is a starting point for recording completion. Use the site’s approved procedure and qualified service provider for chemical handling, verification and return to service. The logger should never actuate valves or authorize a return to service.
Commission a two-tap pilot and decide what to scale
- Measure the baseline. Choose two representative taps, document the product and serving mappings, and record current waste and cleaning procedures. Try POS and shift reconciliation alone if the team cannot yet assign sales volume to a tap or product.
- Test the installed meter. Verify measured volume on ordinary pours and agreed edge cases, including a keg change and low or foamy flow. Test adjacent inputs at the same time, compare the calibration before and after a service interval, and check that the installation remains acceptable to the draught technician.
- Test gaps and service boundaries. Simulate a disconnected meter and reboot, and exercise a network interruption with the logger still powered. Confirm the report distinguishes buffered data, missing measurements and deliberate service periods. Verify cleaning against the technician’s log independently of the pulse data.
- Review with the people who own the result. Give the shift lead the tap, timestamps, volume totals and unresolved causes. Give the draught technician the separate cleaning or temperature exception. Compare improvement in documented volume coverage and time spent resolving exceptions against hardware, installation, cleaning and support costs.
A useful pilot gives the operator a reliable variance worth investigating and a cleaning record someone can verify. Compare that with a commercial dispense reporting system, existing POS controls or better shift logs before adding more sensors.