

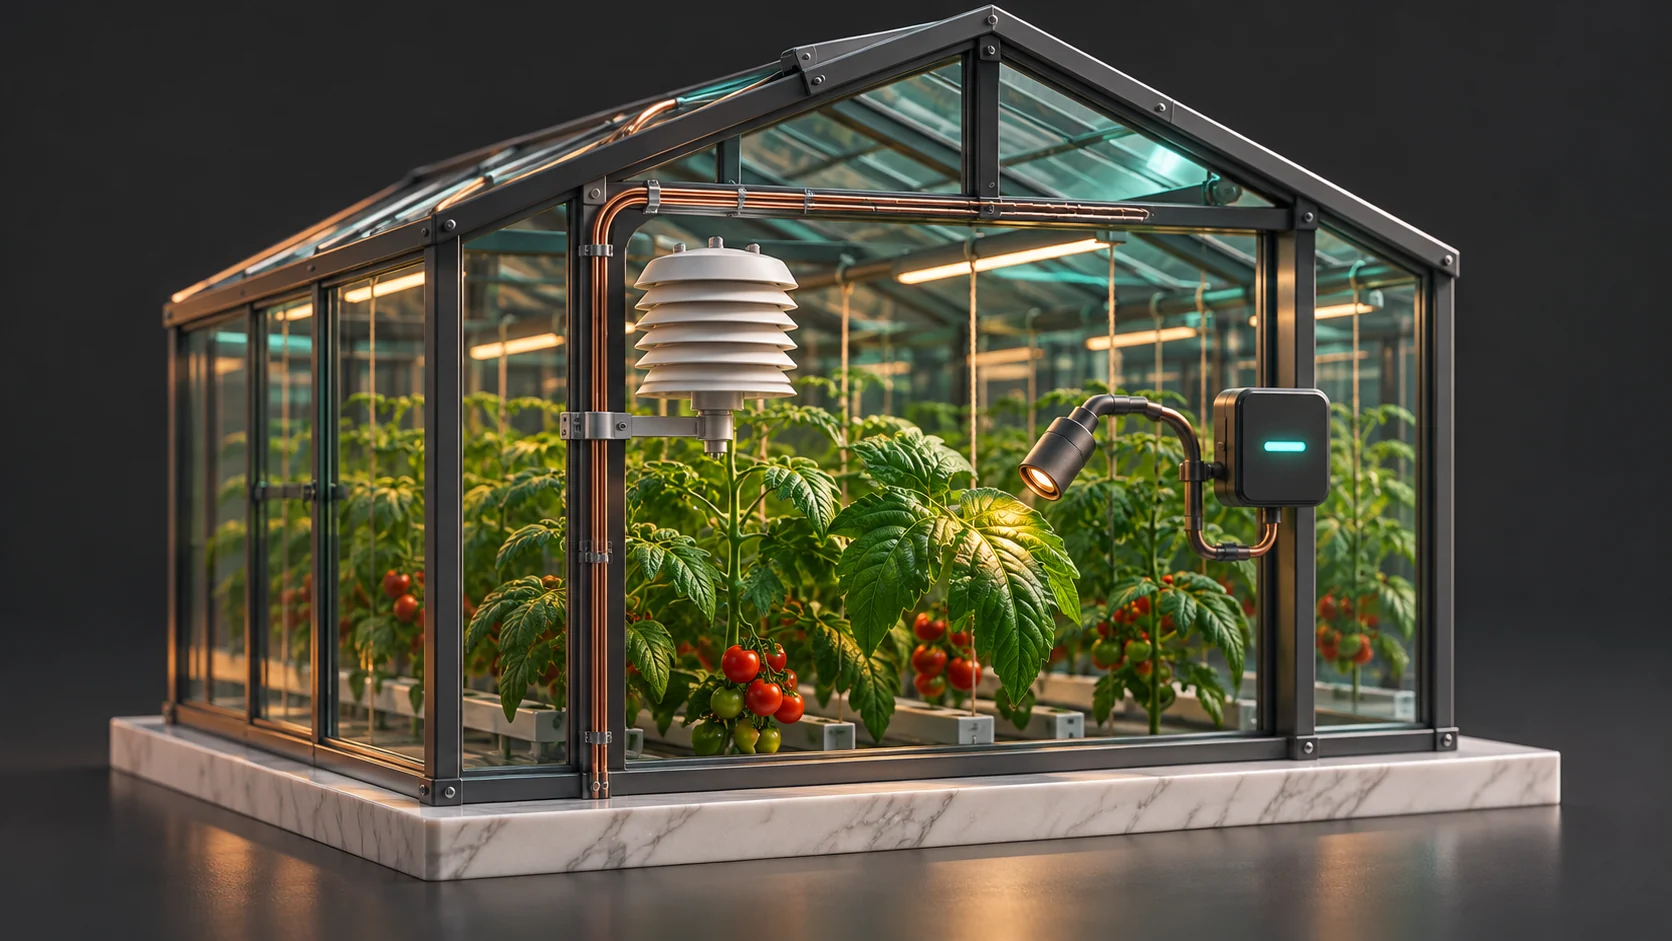
To decide whether to vent or fog a greenhouse, compare the water vapor in the canopy air with the temperature of the leaves. The same room humidity can be acceptable for a warmer leaf and leave a cooler leaf at risk of condensation. Record leaf-to-air vapor pressure deficit (VPD), outdoor conditions and the actual state of the climate equipment before changing a control strategy. Review CO₂ enrichment separately with the approved controller and its safety protections.
This guide is for greenhouse growers, controlled-environment operations teams and their controls integrators. Start with one crop and two representative bays. Use the first pilot to explain the conditions and equipment response while the existing climate system retains control.
For a basic condensation investigation, see how normal humidity can hide wet leaves. The example below shows how measured leaf temperature changes the VPD calculation, then follows that evidence through the climate controller and its equipment feedback.
Calculate the difference at the leaf
Relative humidity is a percentage at the measured air temperature. Warmer air can hold more water vapor at saturation, so the same percentage can represent different amounts of moisture. The following calculation uses vapor pressure in kilopascals (kPa) and assumes saturation inside the leaf at its measured temperature:
- Calculate the saturation vapor pressure at the canopy air temperature. One approximation for common greenhouse temperatures is 0.6108 × exp(17.27 × T ÷ (T + 237.3)), with T in degrees Celsius.
- Multiply that result by relative humidity divided by 100 to estimate actual air vapor pressure.
- Calculate saturation vapor pressure at the measured leaf temperature. Subtract actual air vapor pressure from this leaf value to estimate leaf-to-air VPD.
An air-only VPD uses air temperature in both saturation calculations. Label it as air VPD if there is no valid leaf measurement. Dew point is the temperature at which saturation vapor pressure equals the actual air vapor pressure. A leaf near that temperature has little margin for measurement error. A negative leaf-to-air value means the modeled leaf surface is below the air’s dew point and can be at risk of condensation. It does not confirm liquid water is present. Compare with inspection or an approved leaf-wetness measurement where useful. See Virginia Cooperative Extension’s greenhouse atmosphere guide and the FAO saturation vapor pressure method.
Measure at the canopy and log equipment state separately
- Canopy air temperature and humidity. An ESP32-S3 can read a nearby I²C sensor such as the Sensirion SHT45, whose typical element specifications are ±0.1 °C and ±1 percentage point RH under stated conditions. Use an appropriate aspirated radiation shield with airflow representative of the canopy. Keep the element away from direct sunlight, wetting from fog jets and heat from the logger or the aspiration fan. Verify the assembled probe against a reference. A wet or contaminated sensor and a stopped shield fan can overwhelm the nominal specification.
- Leaf temperature. Aim an infrared radiometer at representative leaves and document the footprint. Keep benches, soil, glazing and heaters out of view. Compare sunlit and shaded areas when they behave differently. Check emissivity and reflected radiation against the instrument maker’s guidance, and verify with an approved reference under both daylight and nighttime conditions. A crop that grows into the sensor’s view may need a new aiming check. Apogee provides field-of-view guidance and an emissivity correction explanation.
- CO₂ and light. A suitable NDIR CO₂ sensor measures gas concentration for crop context. Check range, drift, calibration, humidity and pressure correction as applicable. Verify whether any automatic baseline adjustment is suitable in a continuously enriched bay. A quantum sensor measures photosynthetic photon flux density (PPFD) in the photosynthetically active band. It provides light context and can be used to calculate daily light integral from appropriately timed measurements. Neither light nor CO₂ is a term in the VPD equation. Apogee documents PPFD and quantum sensor response.
- Equipment. Record vent position, fan feedback, fogging status, and the state the approved controller exposes for CO₂ enrichment. Record commands and actual feedback separately. A vent request does not prove that the vent moved. Time-align the field observations, controller events and weather readings so an operator can compare what happened.
Compare two bays with the same air reading
Suppose both bays are at 26 °C and 75% RH. Saturation vapor pressure at 26 °C is about 3.36 kPa, and actual air vapor pressure is about 2.52 kPa. The dew point is approximately 21.2 °C. An air-only calculation gives both bays about 0.84 kPa VPD.
In Bay A, the measured leaf is 24 °C and its saturation vapor pressure is about 2.98 kPa, giving a leaf-to-air deficit near 0.46 kPa. In Bay B, a measured leaf at 20 °C has a saturation vapor pressure near 2.34 kPa, giving about −0.18 kPa. The colder surface in Bay B is below the estimated dew point. Confirm the temperature and humidity sensors are healthy and check that bay for condensation. Review why the leaves cooled and what the vent, fan or heating system was actually doing. These values illustrate the calculation and are not control targets.
A grower reviewing Bay B could keep extra fogging off while the condition is verified and ask the climate operator whether the outdoor vapor pressure and temperature allow ventilation to help. Outdoor RH alone cannot answer that. Venting can remove moisture under suitable conditions, but cooler incoming air can also lower surface temperature. In a dry bay with a sustained verified deficit, review the crop’s documented targets, water status, existing cooling and ventilation before requesting fogging. Fog can raise humidity while lowering air and surface temperature. Compare the measured response after each approved change.
Keep climate authority and CO₂ protections with the approved system
Start by reading a supported data export or approved register map. If using Modbus over RS-485 or TCP, record device address, point type, engineering units, scaling and freshness. Use read-only polling at an agreed rate, preferably through a supported gateway. Keep write functions unavailable in the monitoring integration. The Modbus Organization’s specifications distinguish register reads from write operations. A generic eight-channel relay board or a new PID loop can create conflicts with the controller’s current sequences. Commission changes through the controls provider, with defined priorities and physical feedback.
Keep CO₂ enrichment decisions separate from VPD. An approved sequence may hold enrichment when ventilation is required, when an input is stale, or when equipment is in a fault state. Grower telemetry cannot replace required worker protection. Independent CO₂ detection, ventilation, alarms and shutdown, along with burner and combustion protections where applicable, must remain under the properly designed and approved systems. Do not wire an ESP32 or generic relay directly to an enrichment valve, CO₂ burner or safety circuit. Have qualified professionals establish requirements for the actual installation. See OSHA’s carbon dioxide information.
Test an advisory pilot through real changes
- Compare two zones. Put paired canopy sensors in a representative bay and an area with a different exposure or air path. Compare them with a reference and note crop height, sensor placement, ventilation and weather.
- Follow a full operating transition. Review a sunny period, a fogging cycle and a transition into night. Capture indoor and outdoor vapor pressure, leaf temperature, PPFD and equipment feedback. Agree with the grower what evidence would change the next decision.
- Test uncertainty and failures. Simulate stale data, a failed shield fan, a wet sensor, loss of Modbus data and a mismatch between requested and actual vent position. Mark affected calculations invalid or advisory until a known-good reference returns. Never substitute an old reading for a current decision.
- Measure the operating result. Track validated sensor coverage, differences against reference observations, time near the agreed condensation-risk margin, and response time to confirmed equipment exceptions. Use comparable crop and weather conditions. Review the findings with the grower and controls provider before making changes to live sequences.
A useful first result is a record the grower can read in order: what the leaf and air measurements showed, what the equipment did, and what to verify before the next change.