

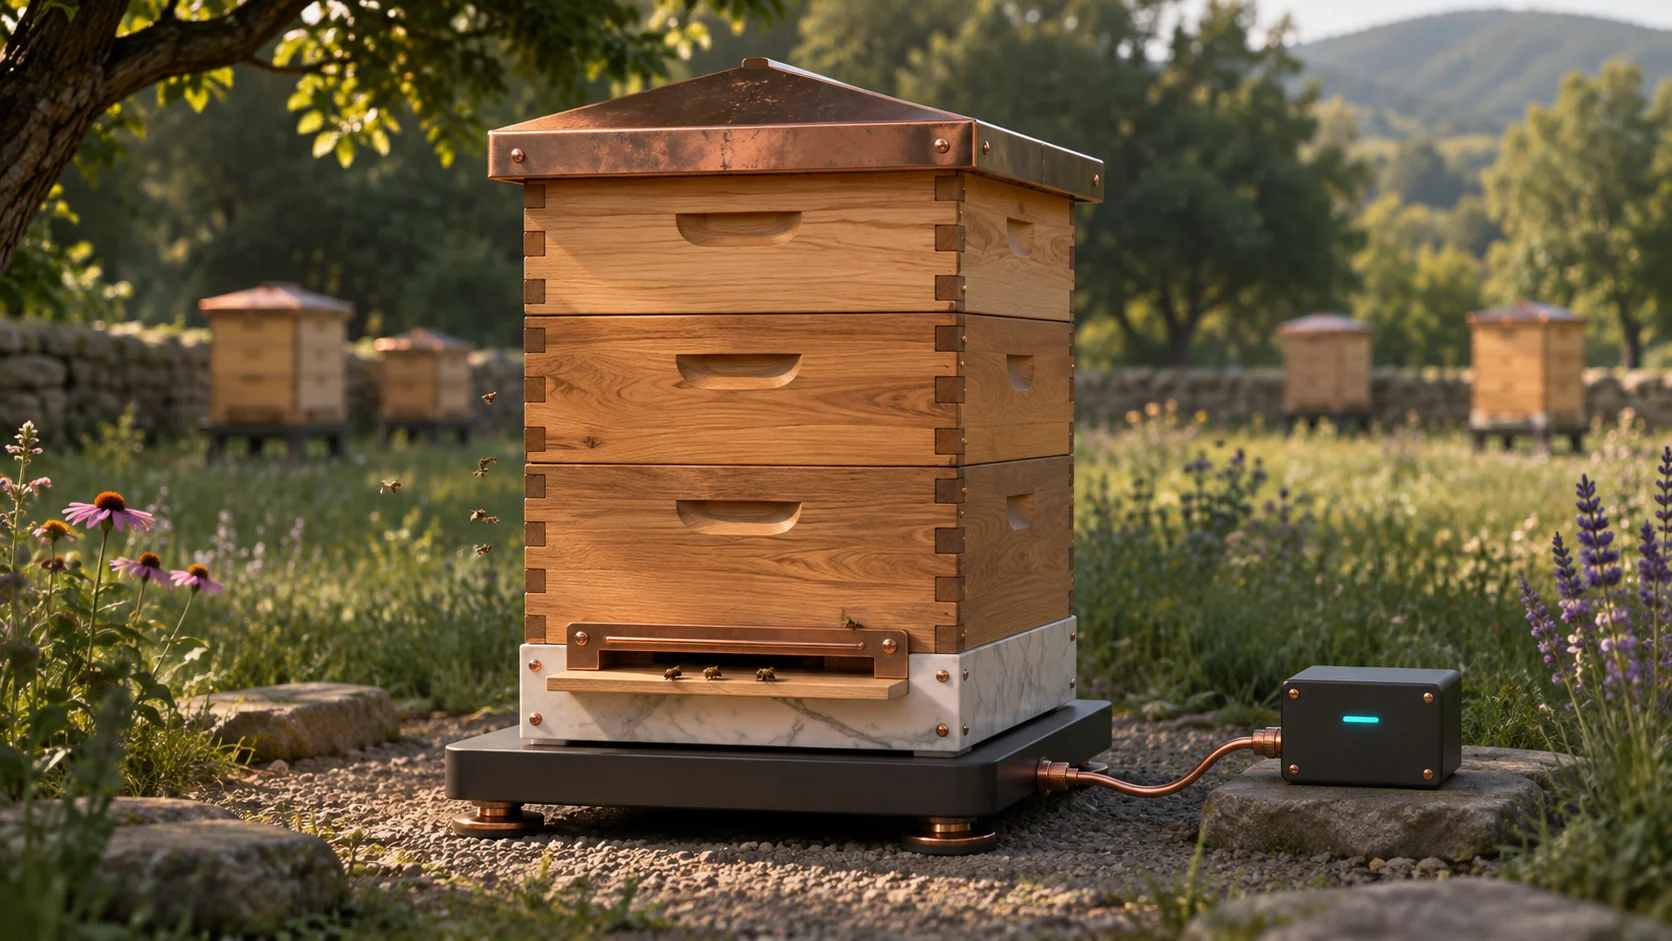
A hive monitor can help a beekeeper decide which colonies to inspect first. Start with a calibrated weight trend, then compare it with local weather and the apiary’s own work log. Add temperature and short acoustic summaries when they help distinguish a recurring change. Keep equipment faults and uncertain observations visible so the beekeeper can check the colony instead of reacting to a label on a dashboard.
This guide is for apiary managers, migratory beekeepers and monitoring integrators. Start with a few representative colonies and an unchanged inspection routine. Evaluate the monitor on whether it helps prioritize a visit.
Measure hive weight repeatably
Put the whole hive load through a stable, level platform. One candidate uses two correctly mounted strain-gauge load cells with a bridge ADC such as the TI ADS1232. Choose load ratings and mounting for a full stack, uneven loads, handling and weather. Check that straps, cables, vegetation and adjacent equipment do not carry part of the weight. Verify zero and known loads at several points on the platform, then repeat with representative hive weight and temperature. Record the smallest repeatable change, not just the number on the display.
A 24-bit converter does not deliver 24 bits of useful weight resolution. Load-cell creep, temperature, moisture intrusion, off-center loading, bridge excitation, cable strain and mechanical settling can move the result. TI’s bridge measurement guidance explains why gain and offset drift matter. Check stability after storms, a site move or any change to the platform. For a portable apiary, record the baseline and placement again after each move.
Label management events such as added supers, feeding, hive moves and harvests. Keep local rain and temperature alongside comparable times of day. Rain can add temporary mass. Forager departures and returns can move weight within a day. A sustained change across comparable dry intervals may warrant a closer look. A whole-hive scale does not separately weigh honey, brood and bees. USDA ARS hive monitoring research discusses the value of separating within-day and longer-term changes.
Add temperature and audio only where they answer a question
- Temperature. Use a suitable sensor such as an enclosed probe based on the DS18B20 1-Wire thermometer. Install it with the beekeeper in a repeatable, colony-appropriate position without obstructing bee space or frame removal. Record how close it is to the brood area and include a shaded outside reference. The brood cluster can move relative to the probe. A point reading may reflect that change, weather or recent opening instead of a change in colony condition. Check the assembled probe’s response and mounting during scheduled work.
- Acoustics. An ESP32-S3 can record short clips from a protected digital MEMS microphone through a compatible I²S interface. Fix the microphone position, gain, sample rate and recording duration, and verify the enclosure does not trap moisture or block sound. Use an FFT from a supported library such as ESP-DSP to compare spectral energy under the same settings. For example, you could test energy between 200 and 500 Hz as an exploratory feature. Reject clipped, obstructed or windy recordings and track background noise from rain, trucks and tools. A changed band level does not identify its source.
Published swarming research used accelerometers in hives and time-dependent analysis. Airborne sound from one microphone is a different measurement, and a simple band level cannot establish queen status or a dependable lead time before a swarm. Treat an unusual sound as a reason to compare other evidence. Follow established inspection and colony management practice, such as the approaches described in University of Georgia Extension’s honey bee management guidance.
Compare two hives after rain and a management change
Suppose Hive A weighs 43.2 kg at 07:00 on a dry day. The beekeeper adds a 4.0 kg super that afternoon. After overnight rain, the next 07:00 reading is 47.8 kg. The measured rise is 4.6 kg, and the documented super accounts for 4.0 kg. The remaining 0.6 kg could reflect wet equipment, forage, or measurement variation. Similar rain-related increases appear on nearby scales and much of the difference fades as equipment dries. Leave the residual unclassified. Do not report it as honey gain.
Hive B has no logged management change. Its dry-morning weight drops from 42.1 to 40.8 kg across two comparable observations. The scale has been shown to repeat within ±0.2 kg under those conditions. The temperature near the brood area also varies more than before, and short audio summaries differ from the recent baseline. Check the scale and service log first. If those checks hold and nearby reference hives do not show the same pattern, put Hive B ahead of Hive A on the inspection list. The readings cannot tell the beekeeper whether the change is due to stores, colony movement or another cause. The numbers are illustrative.
Validate which alerts lead to a useful visit
Set a baseline per hive or comparable hive group, using season, equipment, recent weather and management history. Label events such as feeding, super changes, rain, relocation and equipment trouble independently. Decide with the beekeeper what counts as a useful follow-up and how soon a check must occur to count. Test on hives, dates or apiaries held apart from the data used to choose the thresholds. Compare the sensor recommendation with scheduled manual observations, including some hives that did not alert.
In an example of 100 planned hive-days, 88 have complete enough data to evaluate, for 88% coverage. Among those days, 15 trigger alerts. Independent inspections cover all 88 usable hive-days. Nine of the alerted hive-days warrant follow-up, and three additional cases warrant follow-up without an alert. The alert precision is 9 of 15, or 60%. Recall on the 88 usable hive-days is 9 of 12, or 75%. Review the 12 incomplete days separately. These numbers would suggest checking the causes of false alerts and missed events before relying on the alert to defer routine rounds. They do not measure prevention of swarming or colony losses.
Run an apiary pilot you can maintain
- Check stability through the weather. Compare several hives and keep a known reference load where practical. Exercise rain, sun, cold, wind and an actual equipment change. Verify that flat or missing readings do not hide a failed probe or saturated scale.
- Budget the entire node. Measure bridge excitation and settling, temperature conversion, audio capture, local processing and radio transmission. A lithium thionyl chloride battery option needs a verified pulse-current and cold-weather design for the chosen cell and radio. Evaluate the installed system at end-of-life voltage and realistic transmit retries. Do not infer runtime from the ESP32 sleep current alone.
- Keep the timeline during outages. Buffer compact timestamped observations with a sequence and quality status. Upload them when the link returns and deduplicate by record identity. Show how long the apiary has been without a valid reading. Retain short diagnostic audio clips only as needed, and keep unnecessary speech or unrelated recordings outside the routine data collection.
- Measure the operational benefit. Compare a commercial hive scale, a custom multi-sensor node and ordinary rounds against the same goal. Track inspection prioritization, usable coverage, time to confirm exceptions, battery and sensor service, and the number of avoidable calls to the apiary. Keep the beekeeper’s verified findings as the decision record.
A useful first system shows which hive changed, whether weather or a recorded task can explain it, and which colony needs a person’s attention.